After covering the architectural basics of RIOT in the previous post, we will now see this affects the development quality. This posts covers the way how testing and assessing code quality is currently covered by RIOT and will also address our view on the code quality and technical debt.
Software quality process
In order to maintain code quality, RIOT uses quite a few tools:
Vagrant
Vagrant is a tool used to build and manage virtual machine environments. RIOT has a Vagrant file to download a pre-configured Linux virtual machine that contains all the necessary toolchains and dependencies.
cppcheck
Cppcheck is a static analysis tool for C and C++. It can be used to detect bugs but has a focus on detecting dangerous coding constructs and undefined behaviour like integer overflows and out of bounds checking.
coccinelle
Coccinelle is a utility tool used to match and transform source code. Coccinelle was initially used to perform collateral evolutions, that is when a library API changes the client code needs to change with it, but it can also be used to find defective programming patterns.
RIOT native
RIOT native is a hardware visualizer that can be used to emulate hardware at the API level. This helps if developers don’t have a supported hardware platform, or want to test an application without the limitations and requirements of actual hardware.1
embUnit
Sourceforge’s Embedded Unit is a unit testing framework whose design is copied from JUnit and CUnit, and adapted for Embedded C systems.
Valgrind
Valgrind is a programming tool used for memory debugging, memory leak detection and profiling. Valgrind’s tool suite allows developers to automatically detect memory management and threading bugs, but it can also be used to perform profiling.
GCC stack smashing protection
Stack smashing protection is a compiler feature in the GNU compiler collection used to detect stack buffer overrun.
DES-Virt
DES-virt is a virtualization framework for DES-Testbed, it allows for the configurations in topologies of virtual networks.
Wireshark
Wireshark is a packet analyzer. It is used to analyse and troubleshoot networks, help develop software and communication protocols and for education.
gdb
GDB, or the GNU project Debugger, is a debugger that allows developers to see what is going on inside a program while it executes or what it was doing when it crashed.
gprof
Gprof, or GNU profiler, is a performance analysis tool for Unix applications. It can be used to identify bottlenecks in programs.
cachegrind
Cachegrind is a cache profiler tool in Valgrind’s tool suite.
It pinpoints sources of cache misses, identifies the amount of cache misses, memory references and instructions executed for each line of code.
OpenOCD
OpenOCD is a on-chip debugging, in-system programming and boundary-scan testing tool which can also be used as a flasher.
edbg
Edbg, or now known as CMSIS-DAP is a simple command line utility tool for programming ARM-based MCUs through CMSIS-DAP SWD interface.
RIOT shell
RIOT provides a command-line interpreter similar to a shell in Linux, it facilitates debugging and run-time configuration while testing.1
In order to use these tools appropriately, the maintainers at RIOT wrote a workflow on how and when to use them:
The first step is an optional step, it is more aimed at new developers for RIOT. In this step you set up a pre configured VM using Vagrant.
The next step is the first real step; check your code using static analysis. For this step they use the tools cppcheck and coccinella.
In step 2 the code should be run on a RIOT native instance, then it’s time for dynamic analysis.
This means running Unit tests using embUnit, integration tests, and using Valgrind as well as GCC stack smashing protection to detect invalid memory access.
Step 3 is in case of networked applications or protocols. To test this run several instances of native communicating via a virtual network, and then use Wireshark to analyze the network traffic.
In step 4 they analyze the system state for semantic errors on RIOT native using gbd.
Step 5 is for when there is a suspected bottleneck. Here they use performance profilers like gprof and Cachegrind to detect and identify these bottlenecks.
The next step is for when the code is bug free on RIOT native, then a developer can move on to actual hardware. This means flashing the binaries to the target IoT hardware using a flasher like OpenOCD or edbg.
Furthermore one should use RIOT shell running on the target IoT device for easier debugging.
CI Pipeline
RIOT makes use of tools for their software quality management, and their CI is no different. RIOT’s CI consists of the following tools:
Murdock
Murdock is a simple CI server written in Python, its job is to act as a bridge between github and RIOT’s running scripts.
dwq
Dwq, or Disque Work Que is a tool used to distribute Jobs on git repositories across multiple machines.
disque
Disque is a distributed, in-memory message broker. In RIOT’s CI it is the backend of dwq.
Docker
Docker is a service used to build standardized containers. These containers can be used by developers to isolate their application from its environment.
SSH
Ssh is a software package that allows for secure system administration and file transfers over insecure networks. It can also be used to authenticate a client to a server.
Other
Aside from the previous tools, the CI also contains some other things such as:
Scripts bridging Murdock build jobs and using dwq to build them on worker slaves.
Some HTML files to nicely present Murdock’s state.
And a web server proxying HTTPS to Murdock.
Before a pull-request is merged in the master branch, it is first tested via Murdock. Murdock automates the testing of the static tests, unit tests and compile tests for over 15000 build configurations. Furthermore it automates functional tests on selected platforms.1 By using a Webserver to display Murdock’s state, it is easy to see if a build succeeded or if and why it failed.
Testing
RIOT utilizes two ways of testing, namely unittests and functional, interactive tests.
The main goal of the unittests is to ensure proper functionality of main parts of the RIOT code base. These tests are also incorporated in the CI pipeline, to ensure they are never broken after code updates.
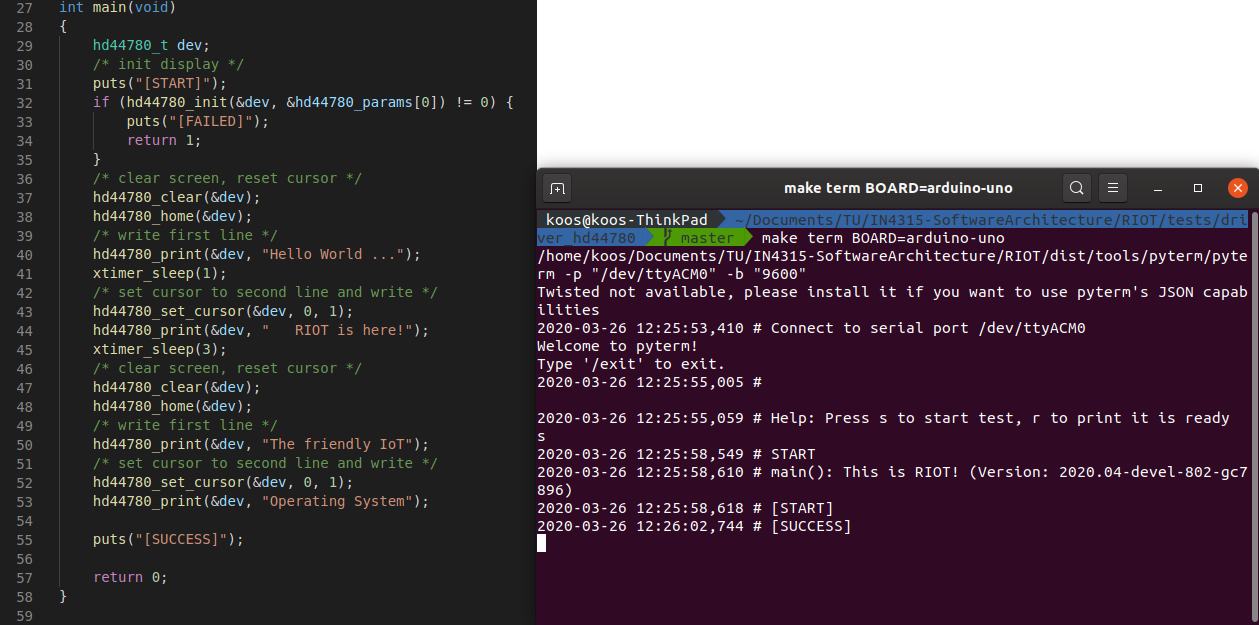
The other way of testing in RIOT takes the hardware into account. A lot of RIOT’s functionality can’t be assessed by simple unittests, but has to be visually checked. An example is an LCD display. To ensure the output is correct, the test, as shown left in the Figure below, will display a few different messages. The user will have to verify the functionality by checking the output on the LCD display. As seen on the right in the Figure below, the output of the test only indicates that the code has been executed, but doesn’t provide insight if it actually works.
Active development
Using the tool CodeScene we have run an analysis to gain insight in what parts of RIOT are under active development.
As expected the cpu module has a lot of activity.
All different kinds of CPUs are often updated and new ones are added, as described in a previous post this is an important step in the roadmap of RIOT.
Interesting to see that there is a lot of development in the net folder of the sys module.
This net folder contains all networking libraries.
From the commit history it shows almost daily commits.
This hotspot makes sense both from the roadmap, but also in general considering the requirements for IoT applications.
A nice thing to notice is that the tests module seems to be a hotspot as well.
By keeping the tests up to date, technical debt can be kept to minimum.
Code quality
To measure code quality, multiple metrics can be used. An interesting one is code duplication. The reason why code duplication has an impact on the code quality, is the effect it has on maintainability. The result is that a single change in functionality might require modifications in multiple locations. In most cases, code duplication is a sign of lazy programming and can be solved by making the code (more) modular.
While evaluating an analysis of RIOT’s codebase provided by SIG, it appeared that it contains quite a lot of code duplications.
However, to conclude that this is a result of low development quality is not correct.
As shown in the Figure below, the main sources of duplications are the modules boards, cpu and tests.
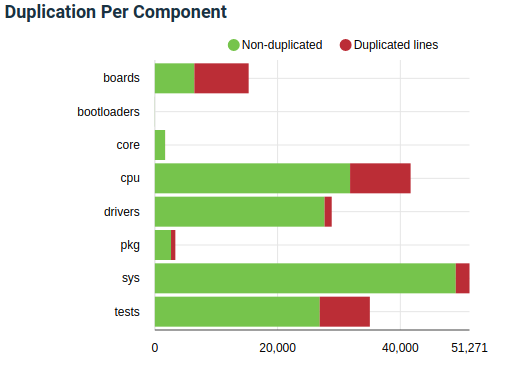
The duplications in boards and cpu can be easily explained, since those components are not ‘real’ software.
These folders contain hardware-specific implementations and configurations.
Since each board and cpu needs its own configuration files, a lot of duplication is introduced because many devices are very similar.
While the approach of having a configuration folder for every single device might have seemed practical in the early development of RIOT, by now it is getting unmanageable.
To solve this problem, developers are working on creating common configurations for similar hardware, this effort can already be seen in the cpu and boards folders.
Why code quality?
The analysis of the importance of code quality, testing and technical debt is divided in three parts, corresponding with different stages of the coding process.
First we take a look at the documentation, specifically at the contributions.md. This document gives some general tips on how to make changes, such as keeping it small, modular and simple, this is in order to simplify the reviewing and speed up the merging process. It describes the requirements for contributing to any changes. The most important section is about how a pull request should be organised, it is mandatory to give an extensive description of the change, which should be as small as possible while still be runnable on their own. Next to this a clear testing method should be defined so reviewers can also check the work.
Next we take a look at some open issues of new features to see if there is any discussion about code quality, testing or technical debt. The amount of comments for each new feature issue range from 2 to 34, the range between 4 and 15 is nicely distributed. Most of the issues start with a comment from one of the members telling if it is a good idea and how to continue on this issue and where to find more information. The more commented issues have a longer discussion from different members or contributors about the implementation or there might be a discussion about the usefulness, as is the case with issue #5825. Issue #13469 is an open discussion about how to improve the stdio implementation to support layered stdio functionality, so there are also discussions initiated by the RIOT members.
Finally a look into the pull requests, the first noticeable thing is that the the pull requests have significantly more comments, on average around 40-50 with peaks up to 180 comments per pull request. Looking at pull request #12877 for example, has implications on all ports and drivers, which will increase the technical debt. So this comment suggests different ways to proceed to change all the ports and drivers, either all at ones or with some backward compatibility in smaller PR’s. Also almost all pull requests regarding new features request changes in the code, either because of style mismatches or failed tests by reviewers.
Overall the RIOT community does a good job at discussing the code quality and testing in the different parts of the contributing process.
Technical Debt
To analyse the technical debt of RIOT, the online code quality tool Sonarcloud is used to provide some overview. The following graph shows the technical debt of the different files within RIOT with respect to the lines of code per file. Most of the files have the highest possible ranking (A) and so the technical debt ratio is only 0.6%. However this is still an overall estimated technical debt of 646 days. When looking at the most files with the most technical debt, sonarcloud shows that most of these files are located in the cpu module. The biggest issue here is duplicated code, this is due to the modularity of RIOT and their conscious choice to specify each board and cpu separately. The debt of the CPU module is around 600 days. Furthermore the modules boards, sys and tests have a technical debt of around 15 days. The remaining modules have a technical debt of minutes or hours.
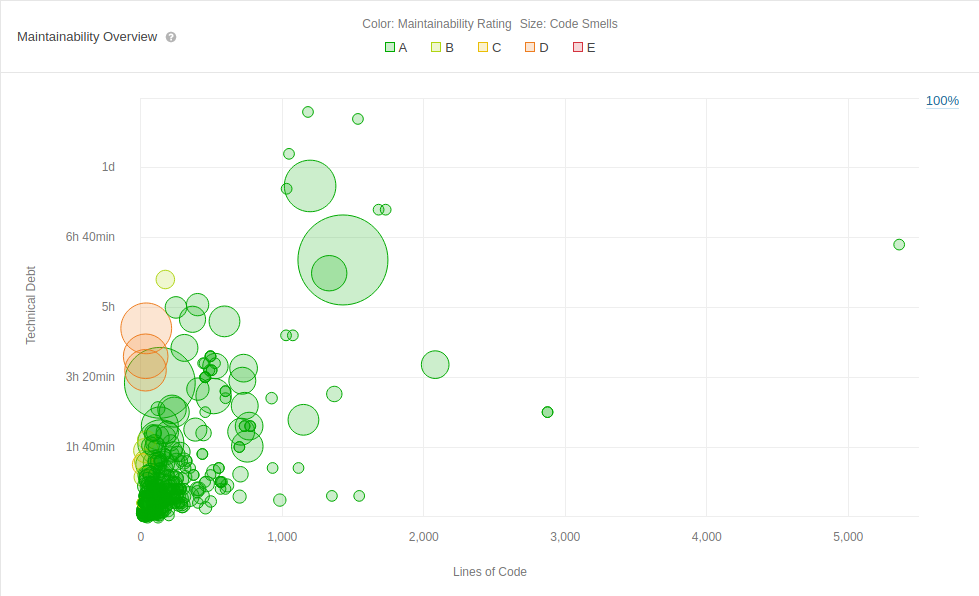
On a side note, the evaluation of sonarcloud is not always the best. For example it counts examples in the doxygen comments as commented code, which gives an unfair picture on the finale score.
To conclude, the technical debt of RIOT is quite good. Especially when taking into consideration that the technical debt caused in the cpu module, by separating all types of cpu’s to keep it a very modulair system, is a design choice. By removing that part of the debt, only a couple of days are left, which will result in a debt ratio of less than 0.1%.